The theoretical foundations and evolution of the method: from the historical 5Ms to the systemic 7Ms
The genesis of the cause-and-effect diagram by Kaoru Ishikawa
Developed in the 1960s by the Japanese professor Kaoru Ishikawa, a leading figure in quality management within Toyota factories, this diagram was initially intended to democratize access to statistical tools for field operators. Ishikawa was convinced that quality and safety should not be the sole preserve of an elite of white-coated engineers, but should be co-constructed by those who operate the machines daily.
The graphical concept is remarkably simple: a main horizontal line leads to the observed effect (the accident, manufacturing defect, environmental pollution), representing the fish's head. On either side of this line, oblique arrows represent the major families of potential causes, forming the bones. This visual modeling allows for moving beyond linear or confrontational discussions to frame the problem spatially and categorically.
The traditional 5Ms: the lens of the physical production environment
For decades, the industrial world relied on the 5M model to analyze its dysfunctions. This model, perfectly suited for standardized mass production, segments causes into five categories:
- Manpower: Human factors directly related to the operator. This includes their theoretical skills, practical experience, physical fatigue, mental load, or even their state of mind at the time of the incident.
- Machine: All machines, tools, collective protective equipment, technologies, and infrastructures used to perform the task. This category analyzes wear and tear, obsolescence, breakdowns, or design flaws.
- Material: Components, fluids, consumables, raw materials, or information that enter the process. In HSE, this includes the analysis of hazardous chemicals, heavy parts to handle, or safety data sheets (SDS).
- Method: Operating procedures, written instructions, maintenance procedures, emergency procedures, and standards defined by engineering or management. The aim is to determine if the method is clear, understood, applicable, and actually applied.
- Environment: The physical environment surrounding the workstation. This category integrates complex variables such as noise level, lighting quality, vibrations, thermal variations (extreme heat or cold), humidity, floor cleanliness, or safety signage.
The 7M Imperative in 2026: Integrating Management and Resources
The experience of contemporary safety professionals has shown that an accident or non-conformity is rarely solely due to a defective tool or an inattentive operator. By limiting analysis to the historical 5Ms, companies consistently overlooked the deep-seated organizational and decision-making root causes. This is why the modern model has been enriched with two crucial dimensions:
- Management: this facet examines leadership style, the clarity of hierarchical lines, management's involvement in workshop operations, time pressure on teams, conflict management, inter-departmental communication, and above all, the maturity of the safety culture. Management determines whether safety is a non-negotiable value or an economic adjustment variable. To measure the impact of this pillar on your teams, it is essential to understand how to sustainably establish a safety culture in the workplace in 2026, a lever that transforms constraint into collective buy-in.
- Resources (Financial and Technological): this seventh dimension analyzes the organization's budgetary trade-offs. Is there a dedicated budget for prevention? Are investments to replace obsolete machinery constantly postponed? Are human resources sufficient to maintain safe production rates? A lack of resources is often the disguised root cause behind a maintenance failure or a lack of training.
Step-by-Step Guide: How to Facilitate a 7M Analysis Workshop On Site
Ishikawa diagram analysis should under no circumstances be a solitary exercise performed by the QHSE manager behind their screen. If you draw up your diagram alone in your office, you will get a biased, theoretical analysis disconnected from operational reality. It is a group facilitation tool that should encourage open discussion and rely on the expertise of those who experience the real work.
Step 1: The Formation of the Multidisciplinary Working Group
Immediately upon the occurrence of the event (e.g., a non-conformity detected during an inspection or a serious near-miss), you must assemble a panel of stakeholders representative of the system being analyzed. The ideal group includes:
- The operator or operators who were direct witnesses or involved in the situation.
- The frontline manager (team leader, production supervisor) to provide insight into daily operations management.
- The H&S professional (facilitator or QHSE manager) who takes on the role of method facilitator.
- A staff representative who is a member of the CSE (Health, Safety and Working Conditions Committee - CSSCT) to ensure the neutrality and transparency of discussions.
- A technical expert not directly involved in the immediate problem (a maintenance technician or a methods engineer) to provide a fresh and objective perspective.
Step 2: The rigorous and factual definition of the effect
Before drawing any part of the diagram, the group must agree on the exact definition of the problem to be solved. This "effect" must be described purely factually, without incorporating assumptions or preliminary solutions. Use the 5W2H method (What, Who, Where, When, How, How Much, Why) to formulate a clear sentence that will be written in the head rectangle of the diagram.
- Incorrect example: "The operator was injured because maintenance failed to do its job on the machine." (This is an opinion and contains judgment).
- Correct example: "On May 14, 2026, at 2:22 PM, operator X sustained a third-degree cut to their right hand during the cleaning phase of the cutting area on packaging line #2." (This is a measurable and localized fact).
Step 3: The brainstorming phase and categorization of causes
The QHSE facilitator draws the skeleton of the diagram on the board with the 7 major axes (Manpower, Machine, Material, Method, Environment, Management, Means). Participants then express all possible causes that could have contributed to the effect's occurrence. The facilitator's role is crucial: they must ensure that each idea is rephrased as a verifiable fact and classified into the correct category.
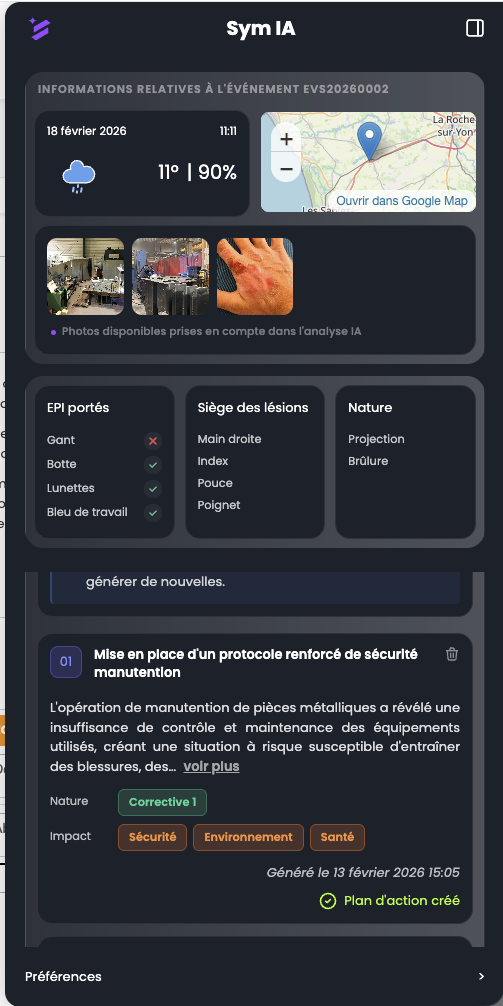
To effectively fuel this collective brainstorming phase without losing valuable upstream data, modern companies rely on agile centralization tools. By using a factory QHSE ISO non-conformity management software like Symalean, prevention specialists can instantly extract all anomalies, recurrences, and photos taken on-site before the meeting, thus providing a factual and undeniable working basis for the working group.
Step 4: Deepening the causes through sub-branches
A general cause placed on a main branch often needs to be dissected to understand its underlying mechanism. Sub-branches are then added. For example, if under the "Machine" axis, the group identifies "Insufficient lighting," one must ask why the lighting was insufficient. "Fluorescent tube burned out for 3 weeks." Why had it been burned out for 3 weeks? "No spare stock for this light fixture model." Here we see that the material cause originates from an issue with Means or a purchasing Method. It is this chaining that gives the method its full value.
Step 5: Prioritization and selection of critical causes
After listing several dozens of potential causes, the working group must identify those that had a direct and decisive impact on the event. To do this, several techniques can be deployed:
- Weighted voting (sticker method): Each participant has 3 points, which they assign to the causes they deem most critical based on their field experience.
- The Elimination Test: For each selected cause, the group asks the question: "If this cause were removed, would the accident or non-conformity still have occurred?" If the answer is no, the cause is deemed critical.
Cross-analysis: practical application table of the 7Ms for an industrial accident case
To concretely illustrate the versatility of the 7M method, let's analyze the case of an accident that occurred in a logistics warehouse: a forklift operator ran over a pedestrian at the intersection of a main aisle.
From theory to practice: building and graphically representing your analysis tree
For the 7M method to be fully effective, its visual representation must be impeccable. An illegible or poorly structured Ishikawa diagram loses all its impact when presented to teams or during an ISO 45001 certification audit.
The structure of our cause analysis matrix
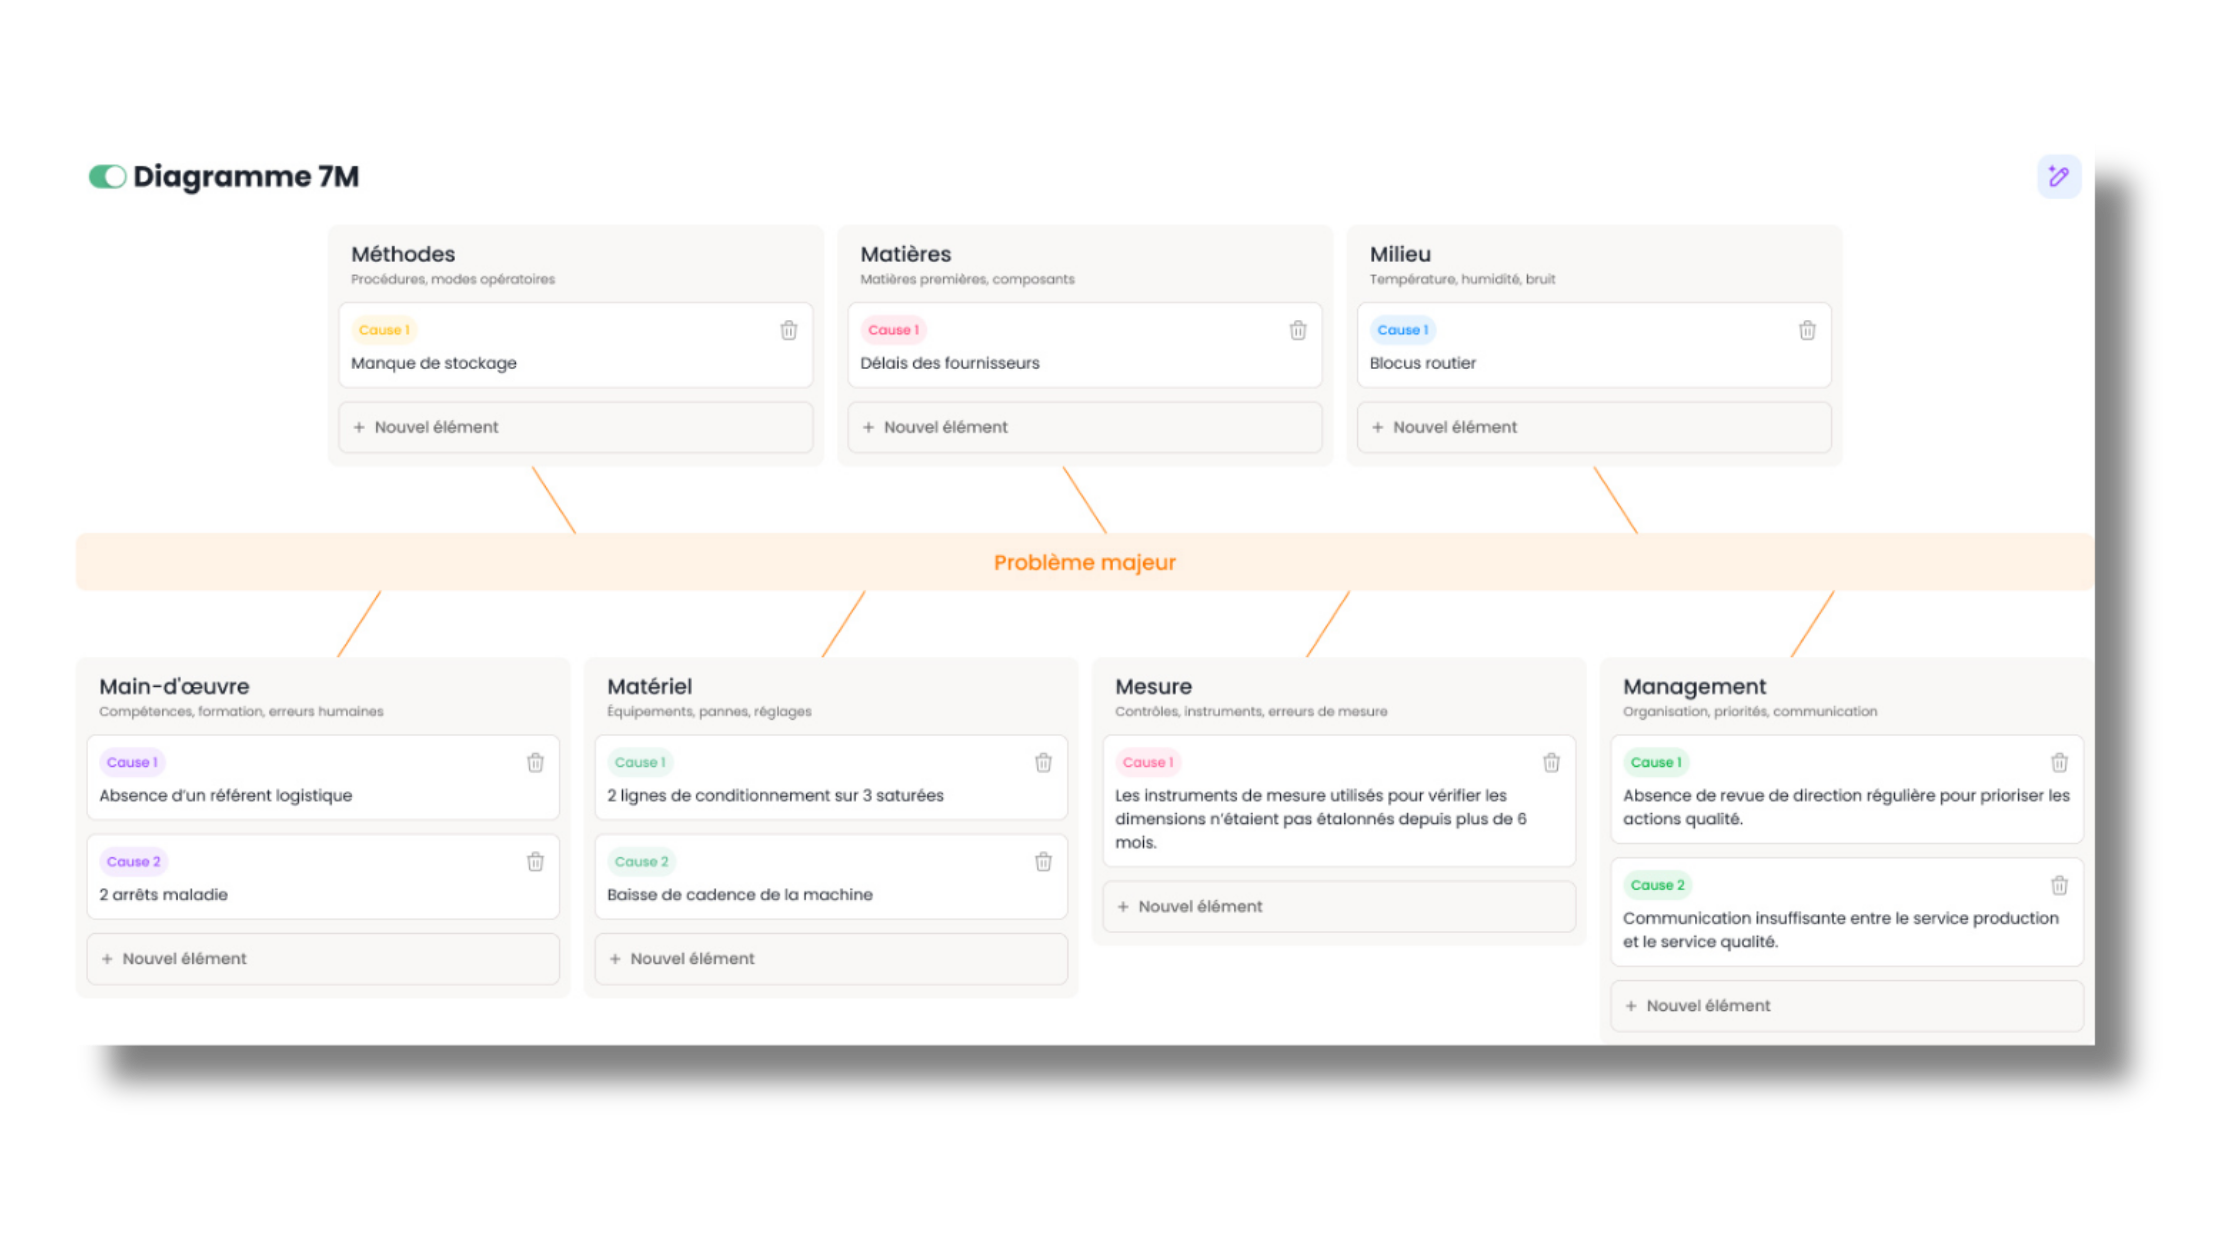
In a rigorous QHSE approach, the graphical structure must faithfully reflect the human thought process during problem-solving. The diagram below shows how an organization visually structures its cause flows to converge towards the resolution of the central effect:
          EQUIPMENT                 MATERIAL                  METHOD
             │                         │                         │
     ┌───────┴───────┐         ┌───────┴───────┐       ┌───────┴───────┐
     │ Machine breakdown │        │ Non-conforming  │       │ Unformalized    │
     │ or wear           │        │ product         │       │ instruction     │
     └───────┬───────┘         └───────┬───────┘       └───────┬───────┘
             │                        │                       │
             └────────────────────────┼───────────────────────┘
                                      │
                                      ▼
[ OBSERVED EFFECT ] ◄───────────────────────────────────────────────── [ ANALYSIS ]
                                      ▲
             ┌────────────────────────┼───────────────────────┘
             │                        │                       │
     ┌───────┴───────┐        ┌───────┴───────┐       ┌───────┴───────┐
     │ Lack of       │        │ High noise    │       │ Budgetary     │
     │ skills        │        │ level         │       │ trade-offs    │
     └───────┬───────┘        └───────┬───────┘       └───────┬───────┘
             │                        │                       │
        LABOR                   ENVIRONMENT               MANAGEMENT / RESOURCES
This modeling helps prevent scattered thinking. Each cause block is linked to its original category by an immutable logical connection, ensuring that the action plan resulting from this analysis will directly and comprehensively address each faulty aspect.
The classic pitfalls of the method and how safety professionals avoid them in 2026
Although seemingly simple, the 7M method harbors numerous methodological pitfalls that novice safety facilitators frequently fall into. Identifying them is the first step to guarding against them.
Pitfall #1: Confusing causes and solutions
This is the most common bias during brainstorming sessions. A participant might exclaim: "The problem is there's no safety barrier!". In doing so, they're not stating a cause, but already proposing a solution. The role of the QHSE manager is to immediately rephrase the intervention: "Why do you need a barrier? What is the current physical hazard?". The correct answer will be: "There's direct coactivity between forklift traffic and pedestrian pathways in aisle B". By clearly identifying the cause (uncontrolled coactivity), you open up the field to several possible solutions (floor marking, physical barriers, reorganization of traffic schedules, presence sensors), instead of prematurely confining yourself to a single, potentially costly or inapplicable option.
Pitfall #2: Looking for a culprit rather than a root cause
In occupational health and safety, accident analysis can quickly devolve into a courtroom where everyone tries to protect themselves by blaming others. If the "Workforce" branch turns into a list of individual accusations ("The operator wasn't careful", " The team leader didn't supervise"), the approach is dead. E-E-A-T and work psychology remind us that behavior is always the result of a given situation within a structured environment. If an operator bypasses a safety cell, the question isn't who made the mistake, but to understand why the system made bypassing it more attractive or necessary to meet production rates.
Pitfall #3: Groupthink and power asymmetry
During an analysis meeting involving field operators and senior management, communication can become constrained. Workers may hesitate to point out a lack of financial resources or management shortcomings for fear of retaliation or out of respect for the hierarchy. The OHS prevention specialist must establish a strict psychological safety framework from the beginning of the session: anonymization of ideas if necessary, use of card systems or neutral digital voting tools, and a clear affirmation that the exercise aims to fix the system, never to punish the individual.
The digitalization of the cause-and-effect diagram: maximizing the impact of your action plans
Managing the 7M method on a flip chart or whiteboard offers undeniable advantages in terms of user-friendliness during a physical meeting. However, once the session concludes, the board is photographed, stored in an obscure network directory, and the agreed-upon actions are manually entered into yet another tracking file. This marks the beginning of operational disconnect.
Ending document silos with QHSE SaaS
Digitizing the 7M method radically changes the game. By building your Ishikawa diagram directly within an integrated software ecosystem, each identified cause stops being a mere word on a screen and becomes a living data point.
When you validate a cause under the "Material" branch, the tool allows you to instantly create a corrective or preventive action sheet, assign it a budget, an internal project lead, and a completion date. Automated reminders are sent to those responsible, and the action's effectiveness is tracked over time. To optimize your entire crisis management process, from the initial report to the conclusion of the investigation, using the Symalean workplace accident management software offers unprecedented responsiveness to field teams and functional departments.
Data cross-referencing for predictive prevention
The digital centralization of your Ishikawa diagrams enables macro-organizational analyses of unprecedented power. A multi-site QHSE manager can, with a few clicks, query the system: "What are the root causes under the 'Management' pillar that have most frequently recurred in our workplace accidents over the past 24 months across all our plants?".
This ability to make data speak transforms the QHSE department. You no longer manage crises on an ad-hoc basis; instead, you identify significant trends and structural weaknesses within your organization to deploy comprehensive prevention policies, justified to your management committee with undeniable statistical indicators.
The contribution of SymAi: automated generation of cause branches
While collective intelligence remains irreplaceable for discussing and validating root causes, the work of structuring, entering, and formatting a 7M diagram can be extremely time-consuming for an already overloaded safety facilitator. This is where modern technological innovation truly comes into its own.
Our tool SymAi, the GDPR-compliant QHSE AI agent, is capable of real-time analysis of natural language found in audit reports, near-miss forms, or voice testimony transcripts submitted by operators. Within milliseconds, our intelligent agent sorts, categorizes, and automatically generates a draft Ishikawa diagram structured according to the 7Ms. The prevention specialist no longer has to spend hours drawing boxes; they can focus solely on facilitating discussions, human validation of hypotheses, and strategic steering of the action plan.
Conclusion and Outlook for the Modern Prevention Specialist
The 7M method and the Ishikawa diagram are not merely bureaucratic compliance tools designed to satisfy certification auditors. They are powerful drivers of managerial transformation. By compelling teams to look beyond the obvious physical and technical aspects, they place people, organizational choices, and means of action at the heart of a company's prevention policy.
By 2026, facing increasingly complex, connected, and economically pressured work environments, prevention specialists can no longer rely on reactive, 'as-it-happens' management. They must adopt these systemic frameworks and combine them with the power of digital solutions to build intrinsically safe work environments. To explore how to modernize all your safety processes and test our advanced diagnostic interfaces, discover our complete Symalean occupational safety management module, designed by industry experts for field professionals.
FAQ - All About the 7M Diagram
What is the difference between the 5M method and the 7M method in QHSE?
The traditional 5M method classifies the causes of a problem along 5 physical axes: Manpower, Machine, Material, Method, and Environment. The 7M method adds two organizational and strategic dimensions essential for modern risk analysis: Management (leadership style, safety culture) and Means (prevention budgets, human and technological resources).
How do you classify a machine breakdown in an Ishikawa diagram applied to safety?
A machine breakdown is initially classified under the branch Machine. However, a root cause analysis should investigate whether the breakdown is due to a lack of preventive maintenance (branch Method), a lack of technician training (branch Workforce), or a refusal of budget to replace the worn part (edge Resources).
What is the most suitable tool for analyzing an ISO 45001 non-conformity?
The Ishikawa diagram based on the 7Ms is the most comprehensive tool for addressing ISO 45001 non-conformities. It allows for auditing the alignment between written procedures, the behavior of workers on the ground, and management's commitment in terms of leadership and resources allocated to occupational health.