


The three pillars of the HOT diagram explained for the prevention specialist
To effectively utilize the HOT matrix, it is essential to understand the taxonomy and scope of each of its three dimensions.
The Technical (T) pillar: physical and material barriers
The Technical dimension encompasses all tangible, material, and technological elements of the work environment. It is the first line of defense for a factory or logistics site. This includes analyzing :
- The regulatory compliance of machinery and production lines.
- The wear and tear and obsolescence of work equipment.
- Collective protection systems (dust extraction, protective guards, light curtains).
- The suitability and availability of personal protective equipment (PPE).
Ensuring the robustness of these physical barriers is essential. To delve deeper into optimizing this aspect, you can consult our expert report on PPE and workplace safety, prevention obligations and levers for effective protection of field operators.
The Organizational Pillar (O) : the framework, processes, and management
The Organizational axis focuses on how work is structured, planned, and managed by the company. This pillar often harbors "latent failures," which are managerial or procedural weaknesses that indirectly undermine the organization's defenses. This pillar encompasses :
- Work schedule organization (team shifts, overtime management, night work).
- The clarity, updating, and accessibility of operating procedures and safety instructions.
- The subcontracting management policy and co-activity (prevention plans).
- The planning and monitoring of preventive maintenance.
The Human Pillar (H) : skills, perception, and mental workload
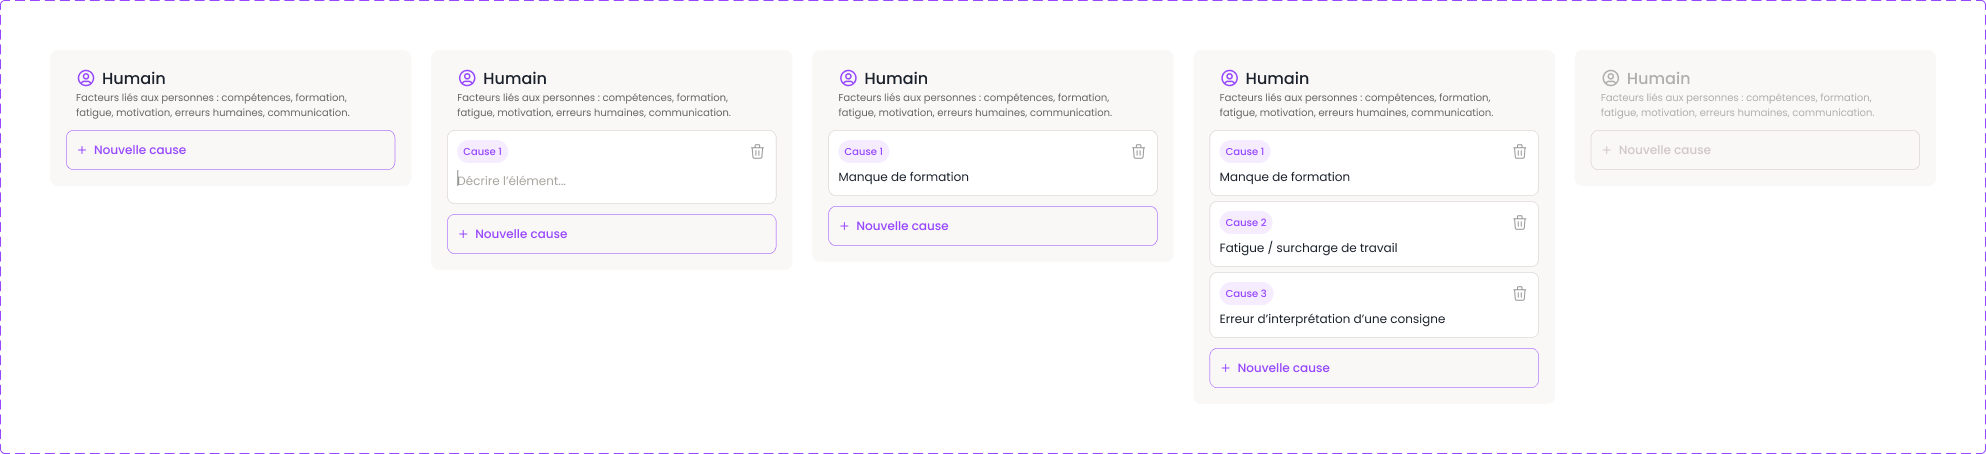
The human factor should never be reduced to the notion of "fault" or negligence. The HOT diagram addresses operator behavior as the result of a complex interaction between their own capabilities and their environment. It examines :
- The actual skills and experience of the worker in their role.
- The level of physical fatigue and psychological stress.
- The perception of risks and situational awareness.
- The mental workload and time pressure felt to achieve production targets.
How to build and balance your HOT matrix ?
The main benefit of the HOT diagram is to ensure that an action plan does not lean solely to one side, thereby guaranteeing a holistic approach to the situation.
The standardized analysis grid (concrete example)
To guide your working groups (involving management, prevention specialists, and CSE members), you can project or print a structured matrix like this :
Technical Axis (T)
• Non-compliant equipment ?
• Lack of protection ?
• Inadequate tools ?
• Faulty alarm / sensor ?
Organizational Axis (O)
• Missing or unclear procedure ?
• Pressure on production rates ?
• Lack of communication ?
• Unplanned maintenance ?
Human Axis (H)
• Lack of H&S training ?
• Significant fatigue or stress ?
• Misperception of danger ?
• Routine or overconfidence ?
The essential link between Human and Organizational factors
The management of professional skills and the regulatory tracking of certifications lie at the exact intersection of Human and Organizational aspects. Ensuring an operator possesses the required skills before assigning them to a dangerous task is imperative. To automate this oversight and avoid managerial blind spots, discover why adopting a OHS software for managing prevention passport declarations becomes a strategic asset for the company.
Methodology: balancing action plans to prevent recurrence
Once the diagnosis is established using the three pillars, the QHSE manager's role is to allocate corrective actions. An effective action plan must distribute measures across all three areas.
If, after analyzing a near miss, your action plan only contains items like "Remind the team of the instruction" (Human Factor) or "Install a warning sign" (Technical Factor), you're overlooking the organizational root cause. Why was the instruction forgotten? Why wasn't the hazard identified beforehand? To centralize all these decisions and manage your prevention plans smoothly, deploying a comprehensive occupational safety management module allows each action item to be linked to its original HOT axis, ensuring perfect traceability during management reviews.
Digitize HOT Diagnosis for Collaborative Prevention
In 2026, managing risk matrices on paper or through isolated Excel sheets hinders companies' responsiveness. Digitizing QHSE tools allows for direct interconnection of HOT analysis with other business processes.
When a non-conformity is detected, its categorization according to the Human, Organizational, and Technical model is done directly online. This instantly feeds your Key Performance Indicators (KPIs) and populates your Single Risk Assessment Document (DUER). In this regard, the use of Symalean, the ISO QHSE non-conformity management software, offers a centralized platform to transform every detected anomaly into a structured continuous improvement opportunity.
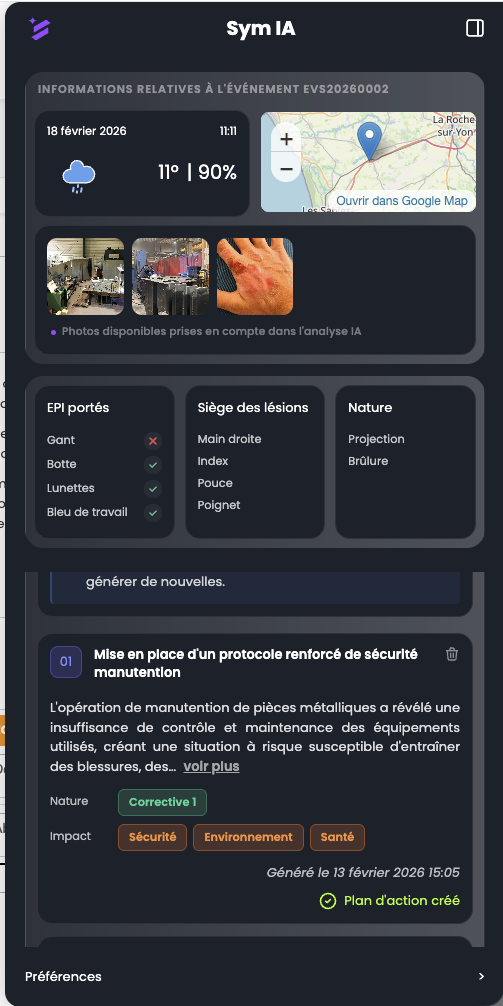
Furthermore, our intelligent agent SymAi, the GDPR-compliant QHSE business AI agent, is capable of automatically pre-categorizing field anomaly reports within the HOT matrix through semantic analysis, drastically simplifying the sorting and formatting work for QHSE teams.
The HOT diagram is much more than a simple classification matrix ; it's a safeguard against oversimplifying risks. By compelling managers and prevention specialists to simultaneously investigate Human, Organizational, and Technical factors, it enables the design of intrinsically safe and resilient work environments.



.png)